Monitor the User and Storage Usage Dashboard
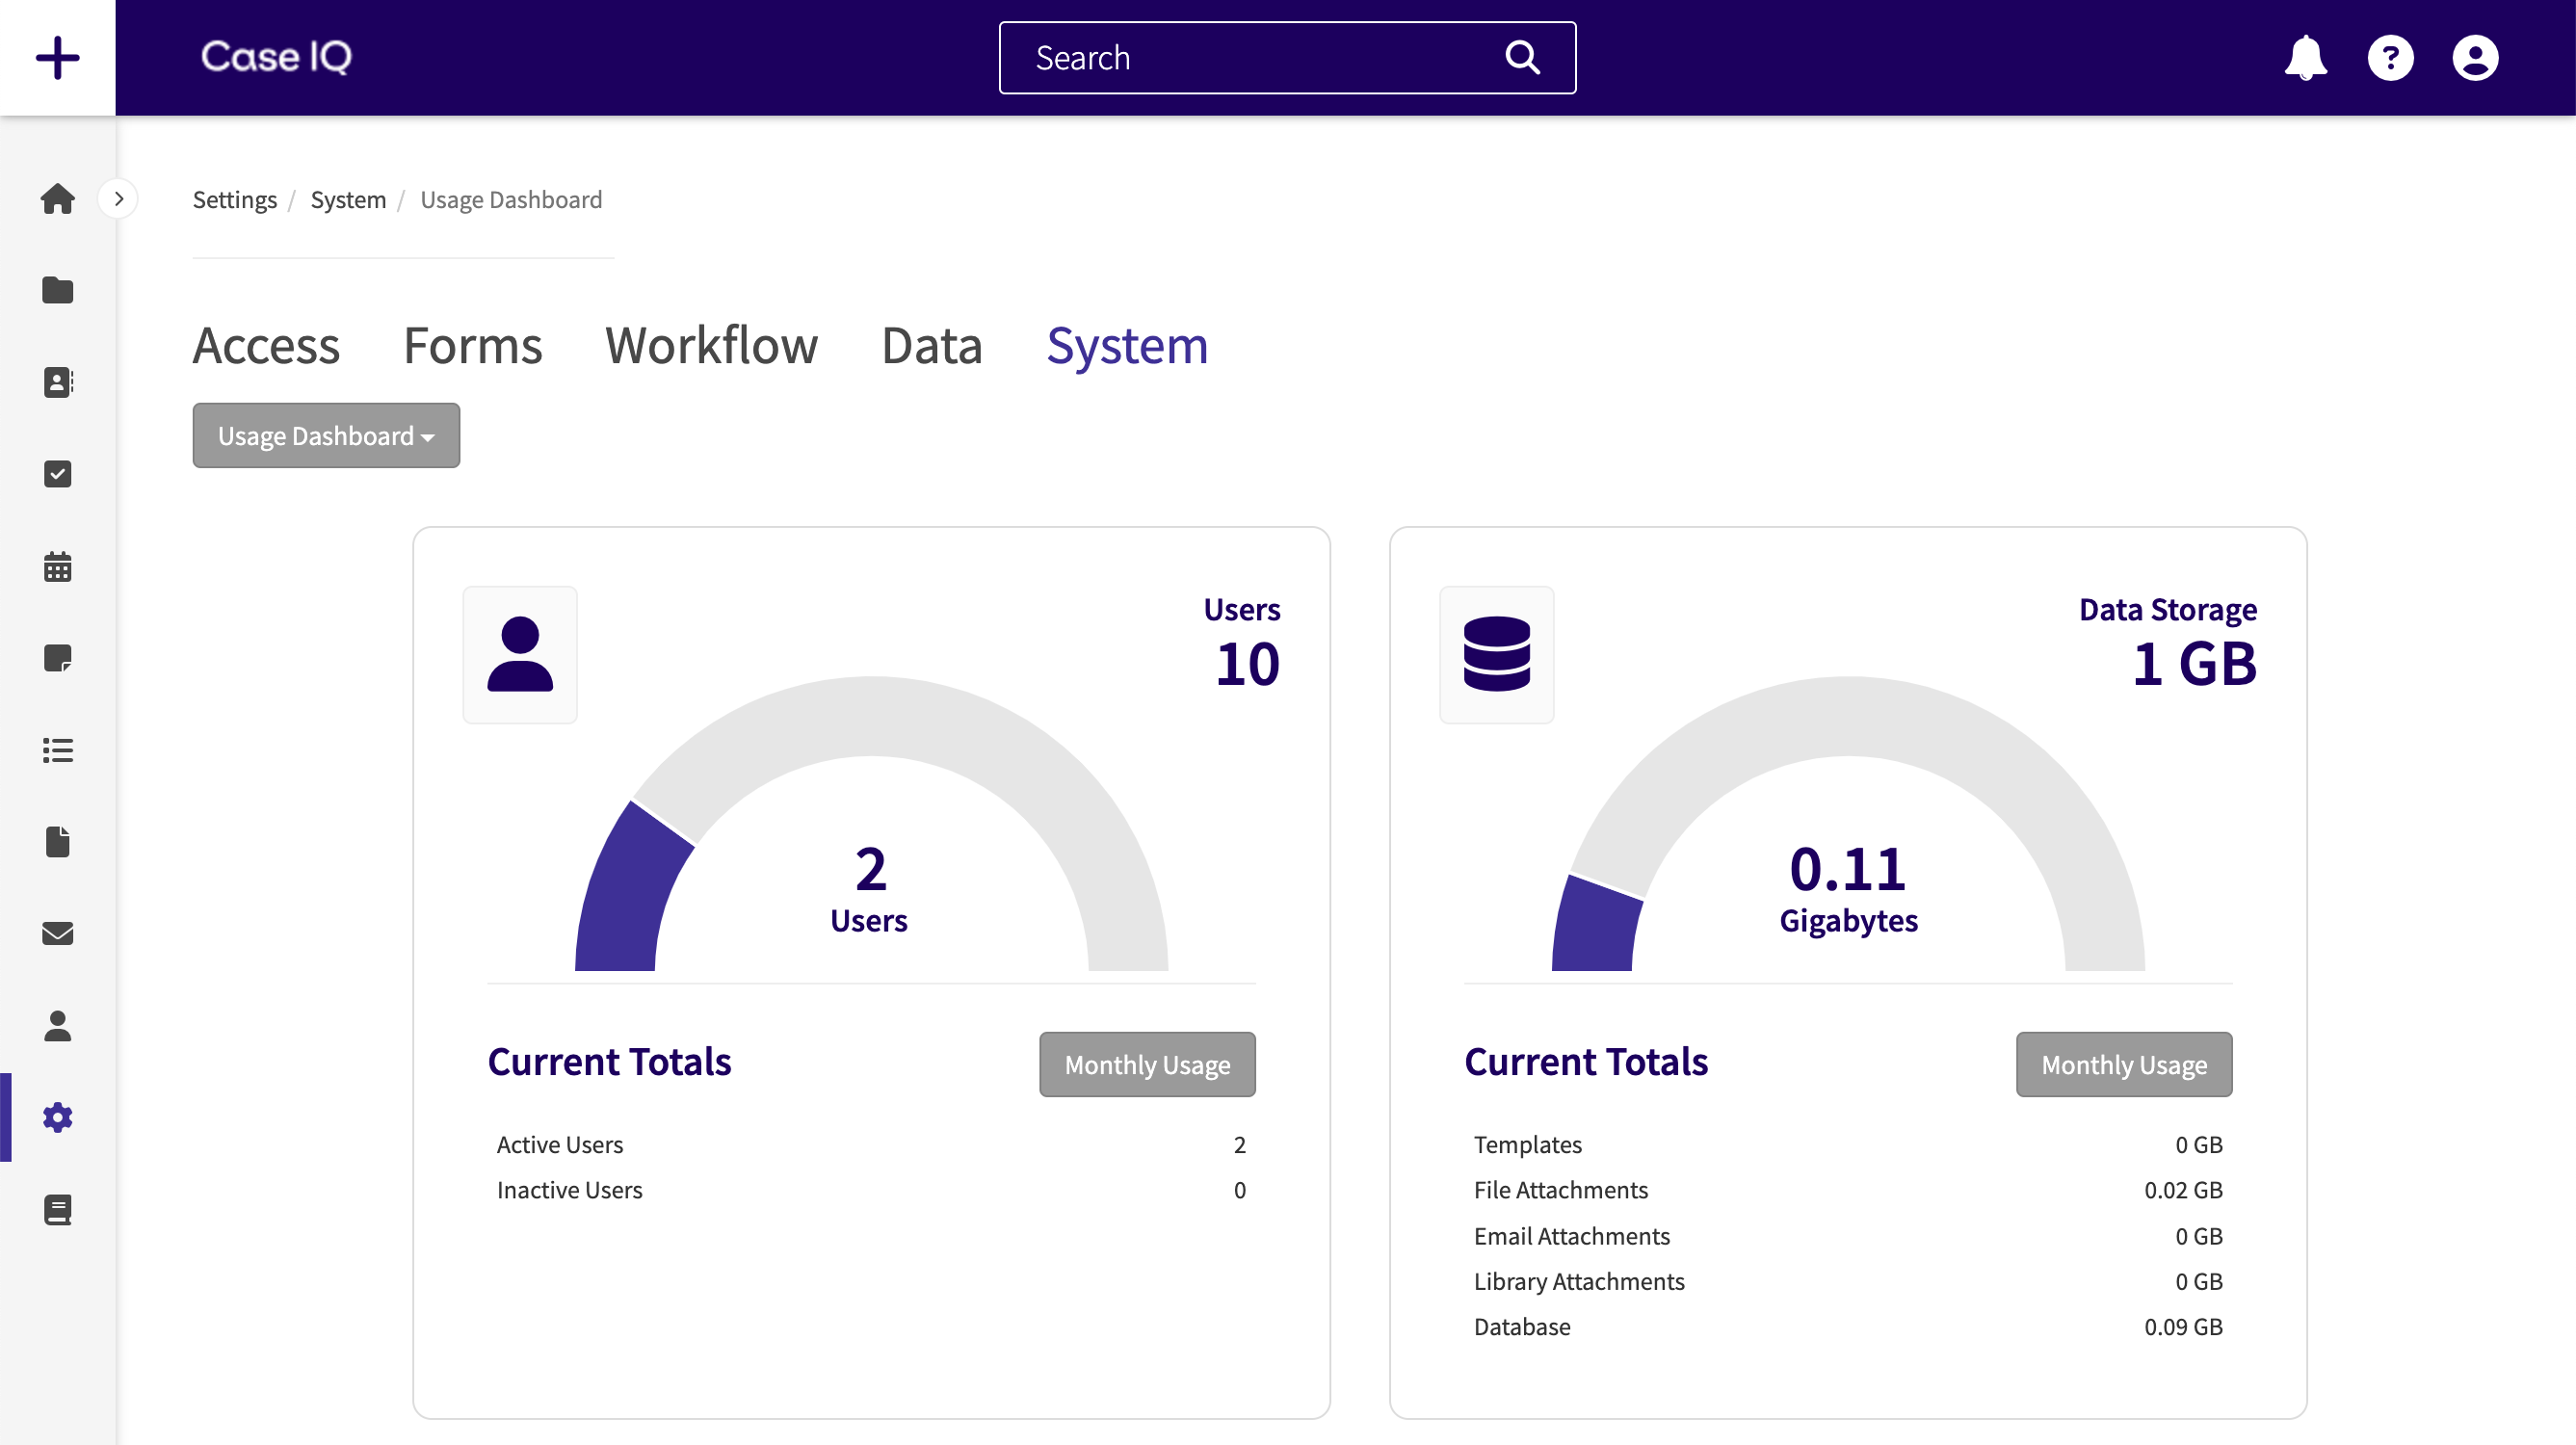
The Usage Dashboard allows System Administrators to monitor the number of active and inactive users and data storage usage by month. Access the Usage Dashboard by selecting the “Usage Dashboard” option on the System tab.
Usage Dashboard Allowances
The Usage Dashboard provides an estimate of your usage compared to your user and data storage allowance amounts in your contract. However, the dashboard is not connected to your billing information. If you have any concerns about your usage, please reach out to your Case IQ Account Manager.
The two main components of the Usage Dashboard are the Users Odometer and Data Storage Odometer. The Users Odometer, which is the modal displayed on the left side of the Usage Dashboard, visually represents the overall number of active users in comparison to the maximum number of active users allowed. The main elements of the Users Odometer are numbered in the screenshot below and descriptions are provided following the image.
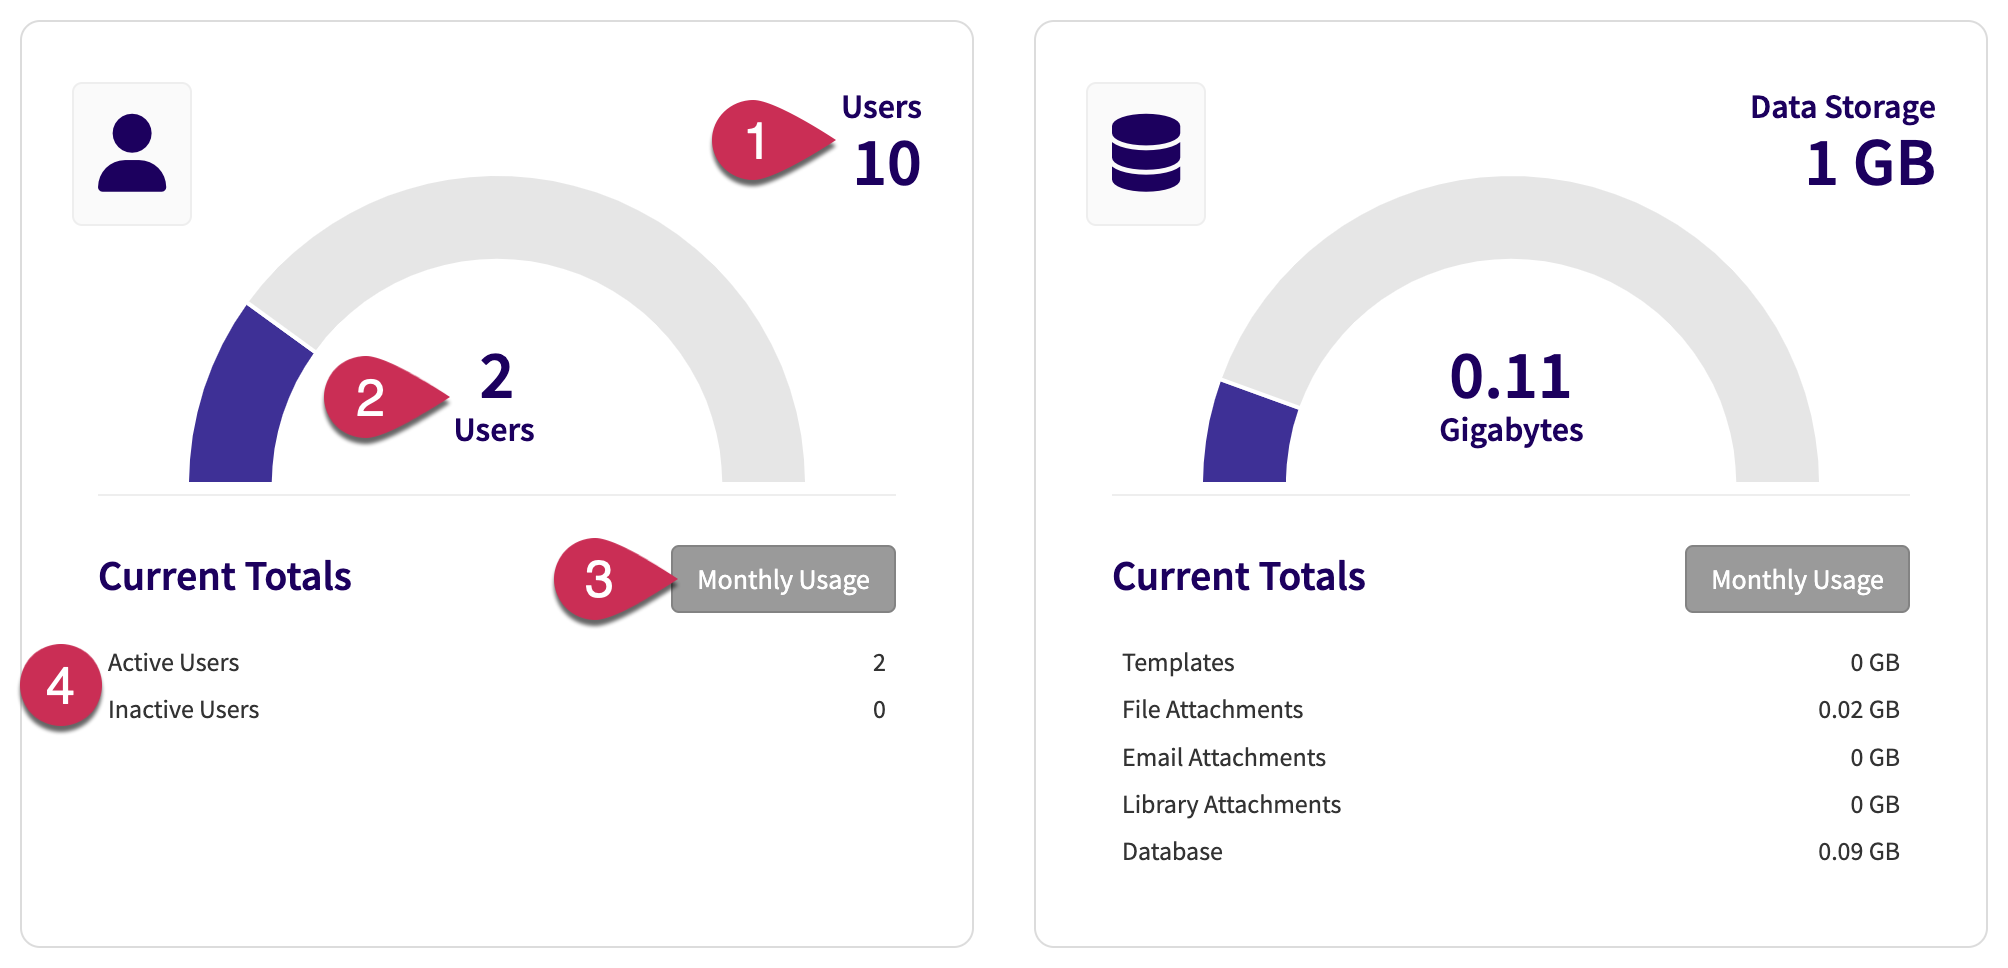
- User Allowance: indicates the number of allocated active users per your contract. If the highest number of active users in a month exceeds the user allowance, the estimated overage charges for the number of additional users will be displayed under the user allowance.
- Highest Number of Active Users: the odometer shows the highest number of active users during the current month, which is calculated daily at midnight. This number will not decrease during the current month, even if you deactivate user accounts.
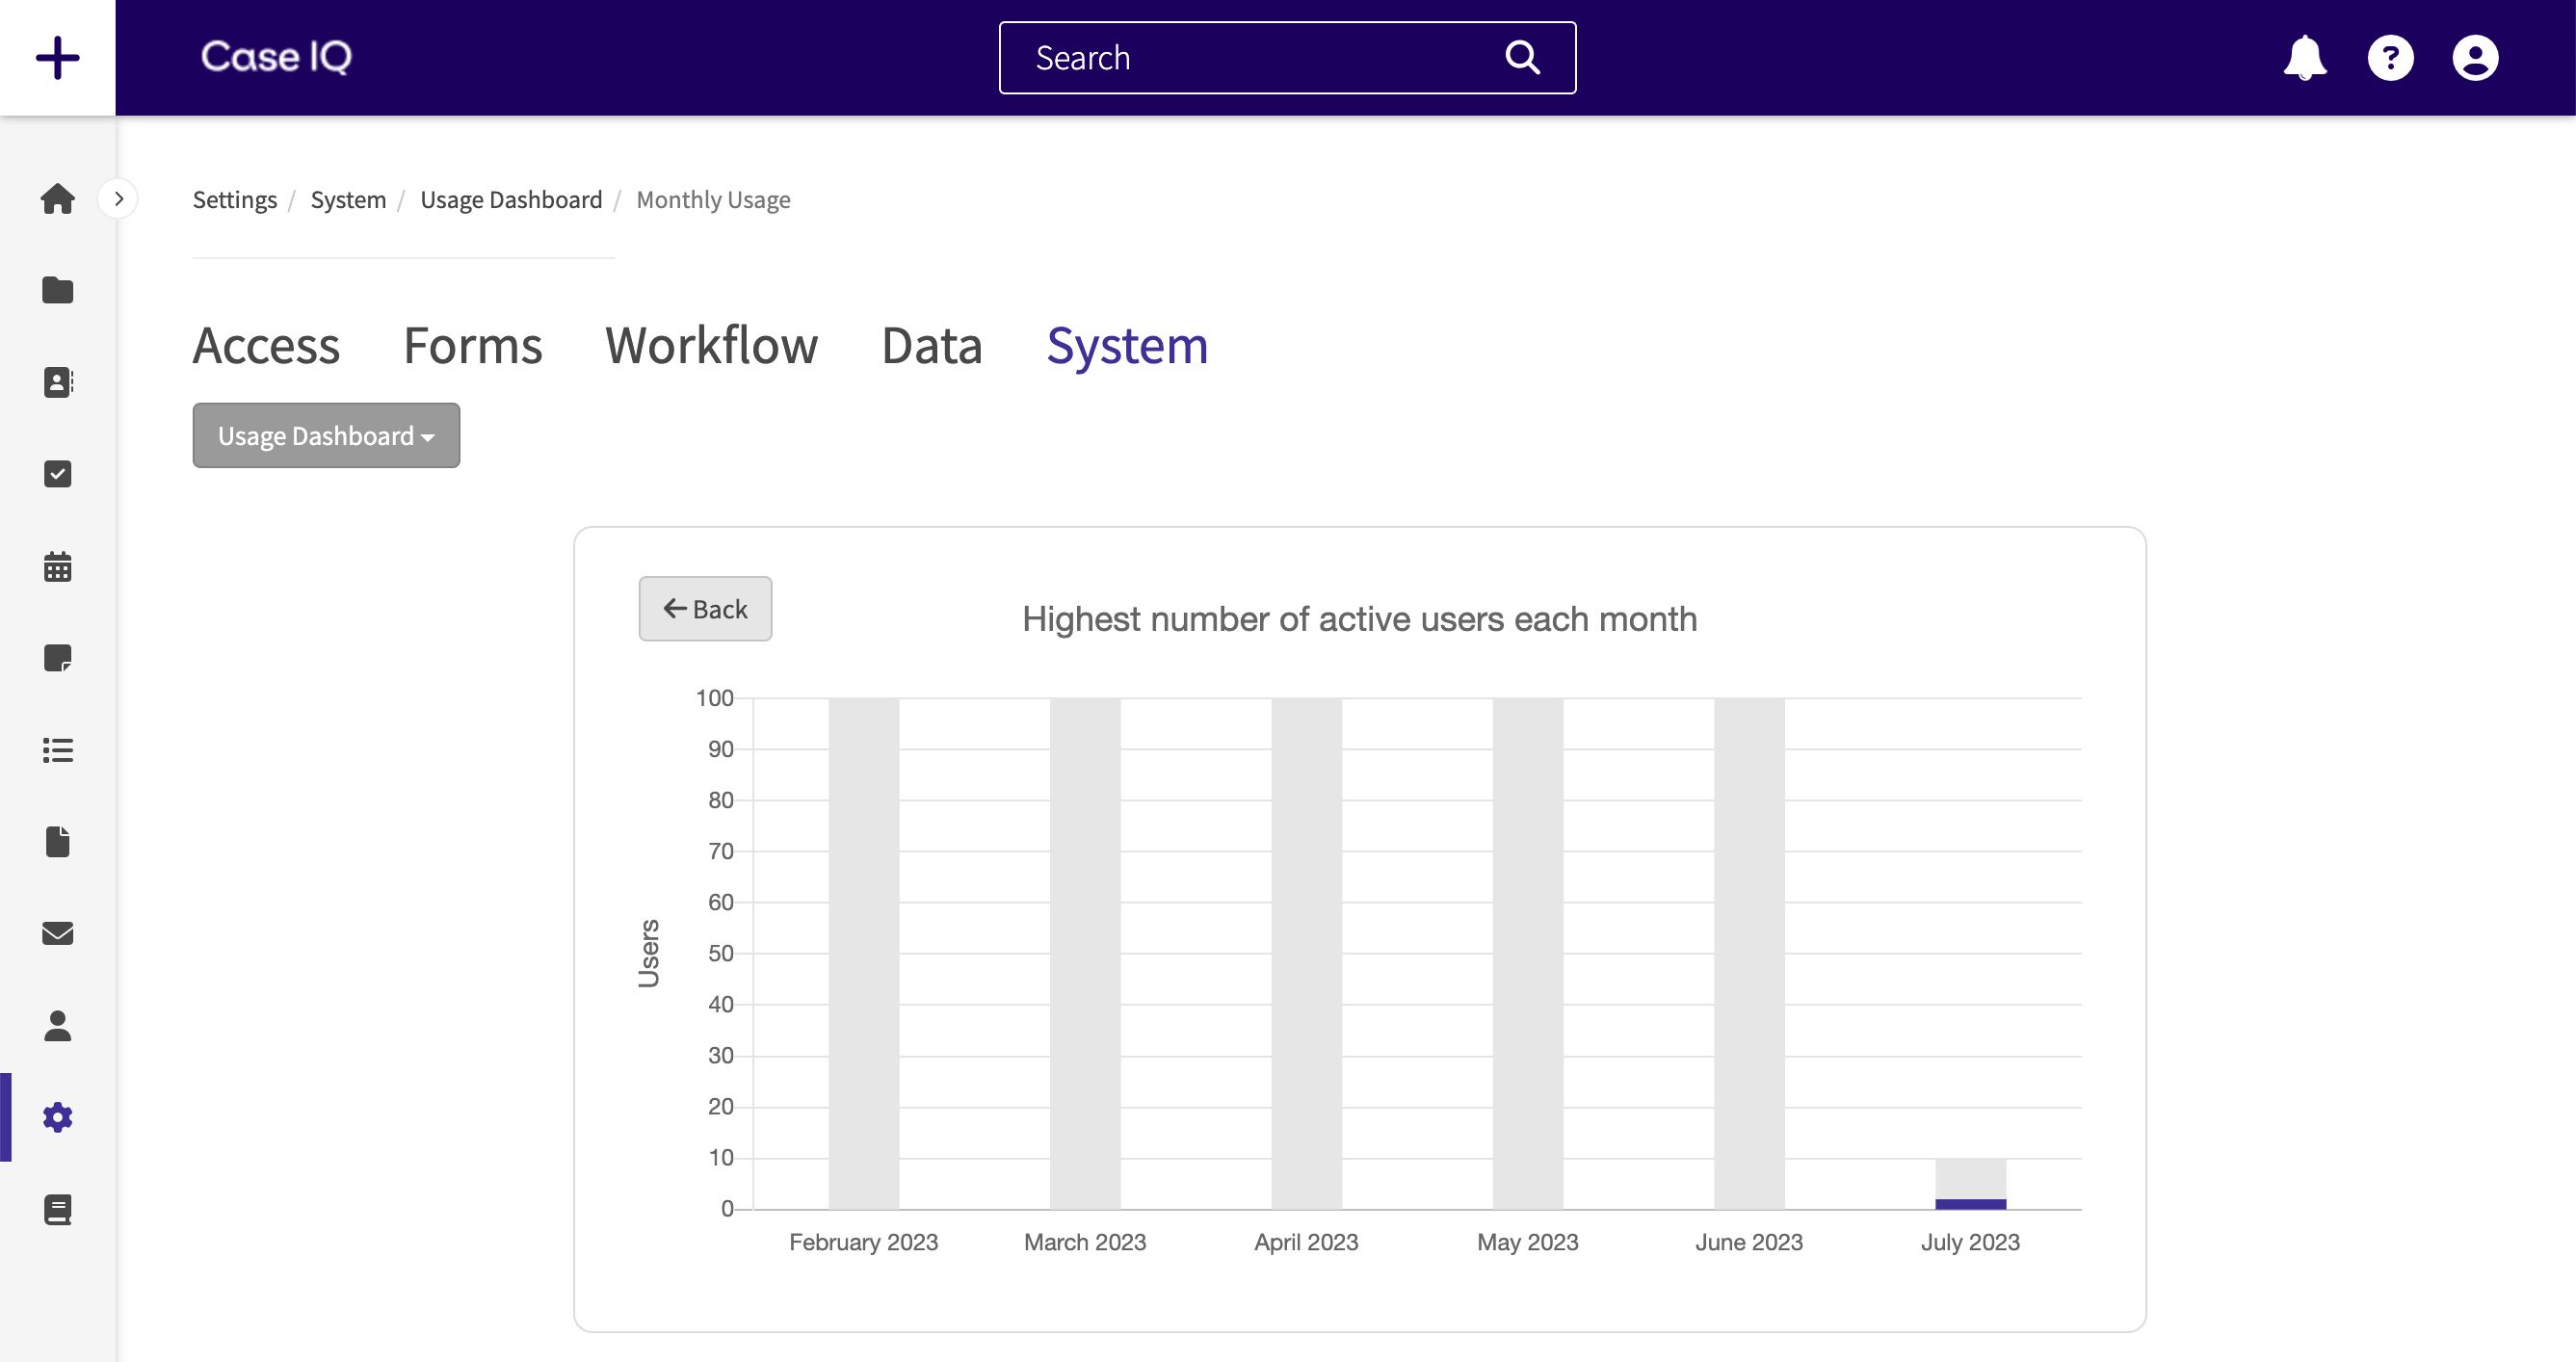
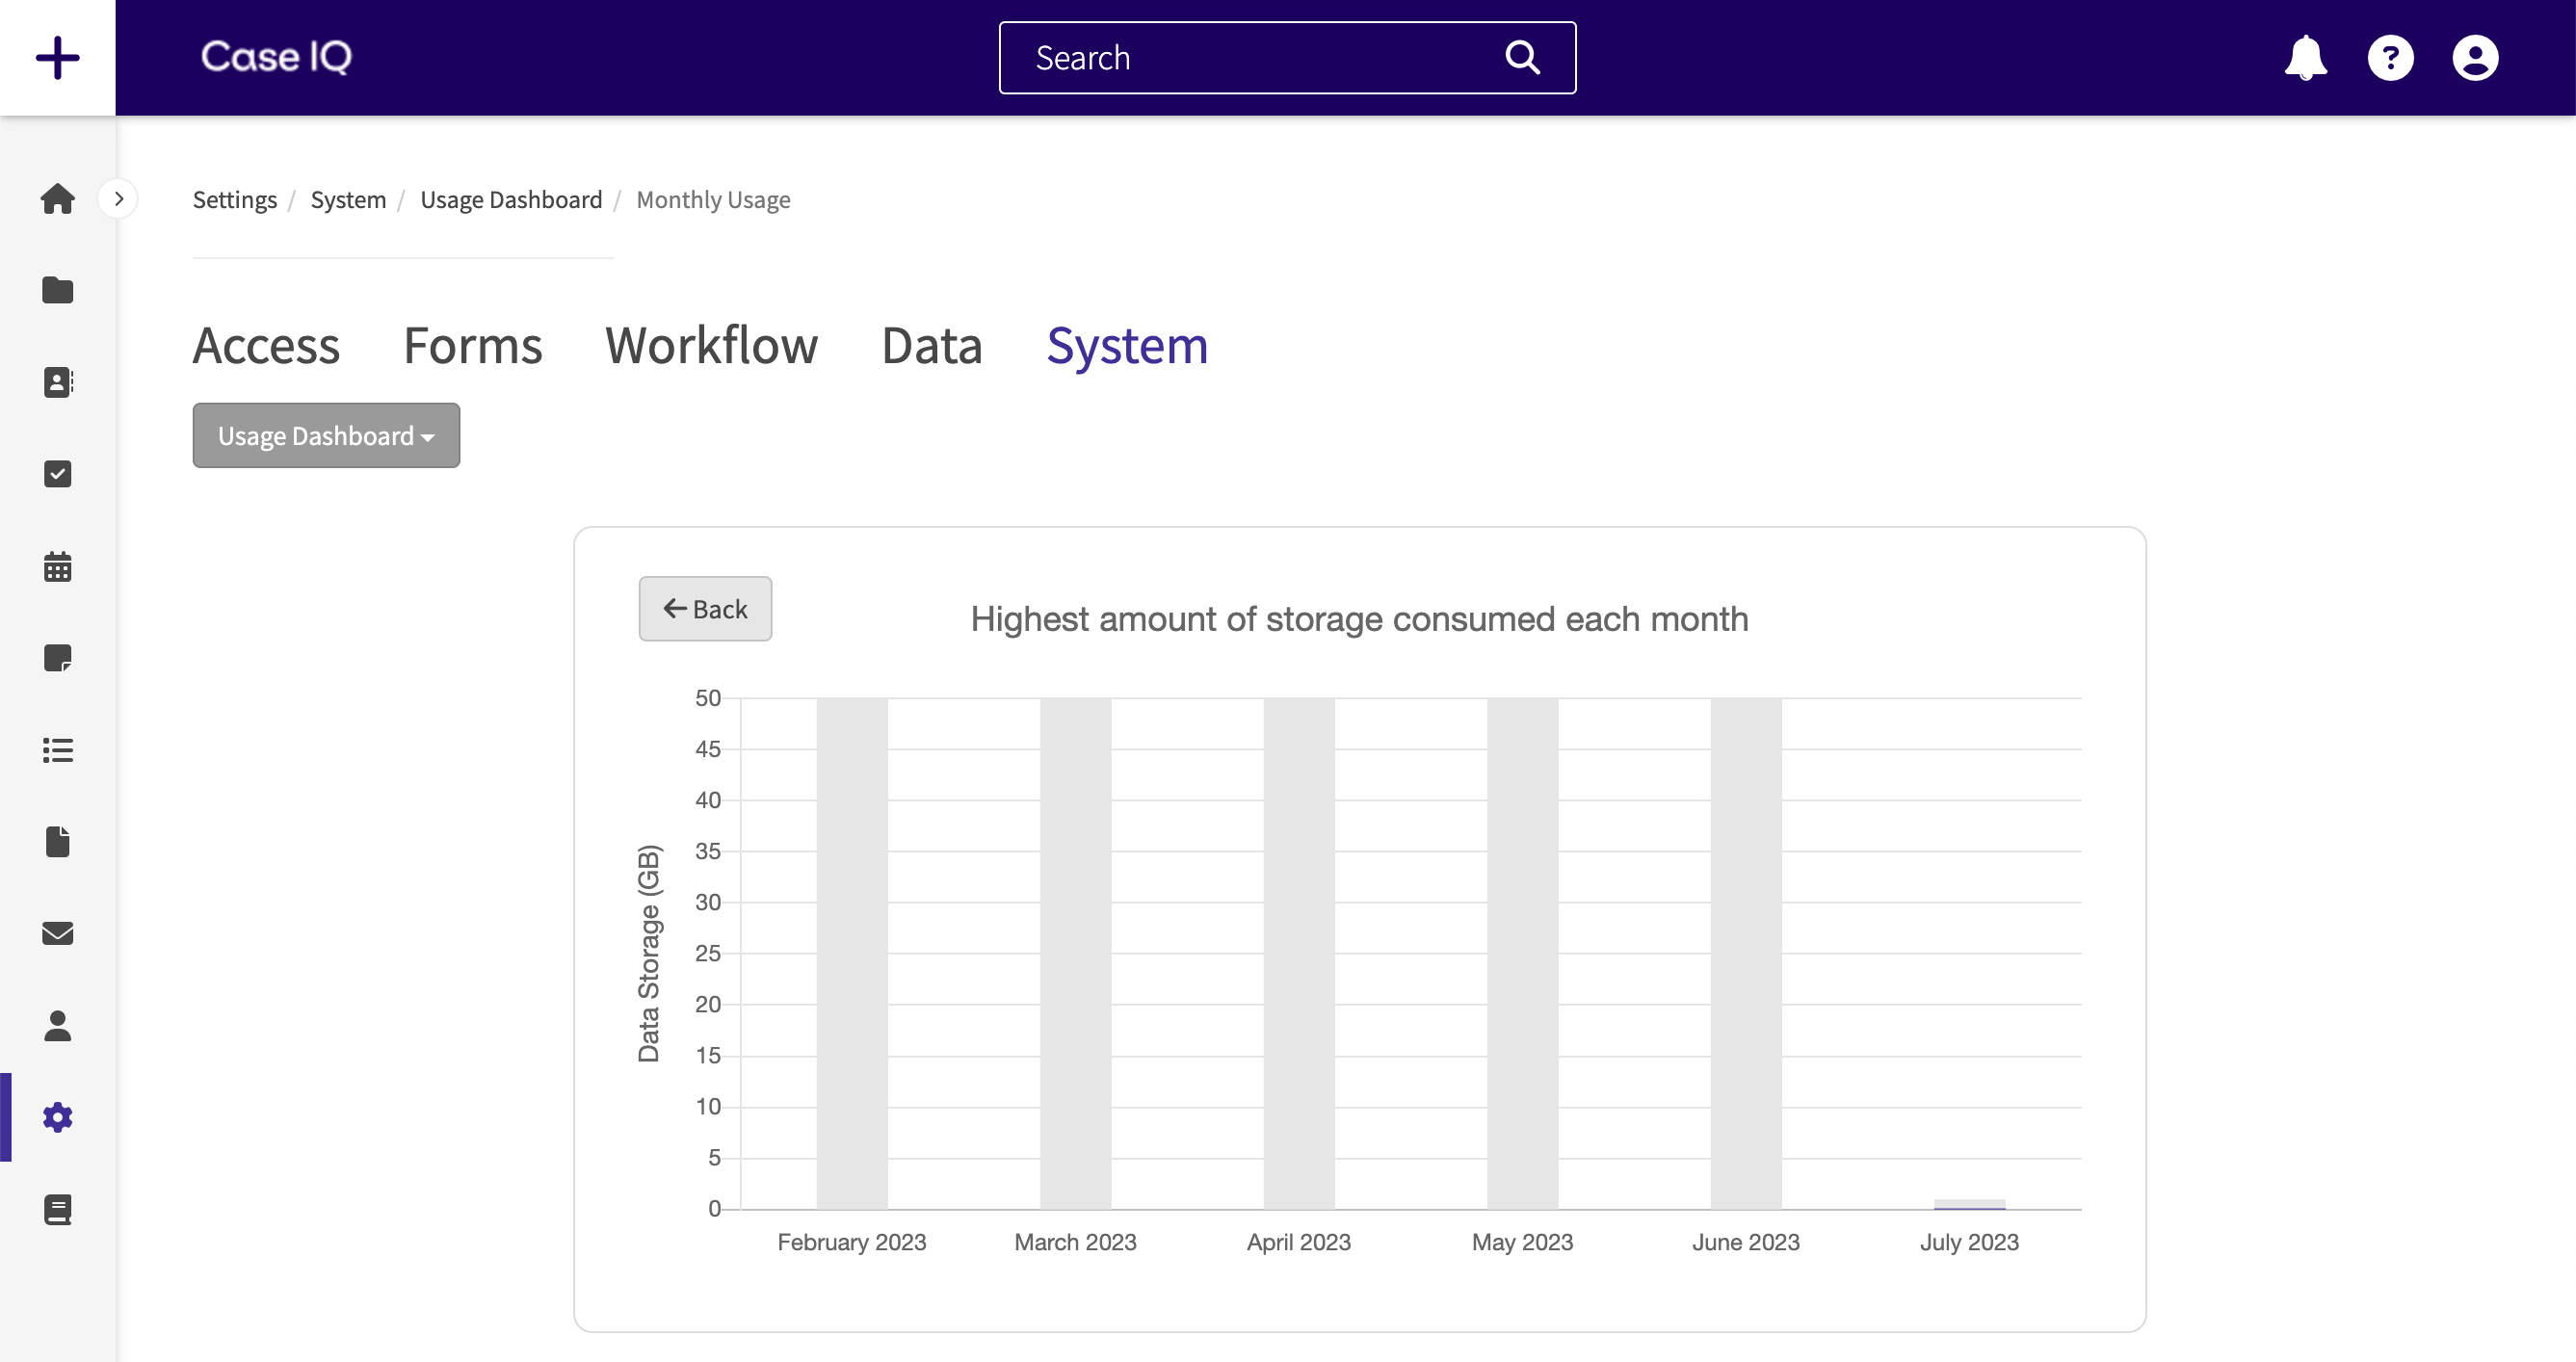
- Monthly Usage button: click to see a chart of the highest number of active users for each month (see example below). You may not see data for previous months if you have recently upgraded your application.
- Current Totals: the current number of active and inactive users in your application, which are updated in real time. The current totals will immediately reflect any user accounts added or deactivated. This means that the current totals and numbers in the odometer graphic (#2 in the Users Odometer screenshot above) may display different values before the odometer is updated at midnight.
The Data Storage Odometer, shown on the right side of the Usage Dashboard, represents the current data storage in the application and displays a breakdown of the type of data stored. The main elements of the Data Storage Odometer are numbered in the screenshot below and descriptions are provided following the image.
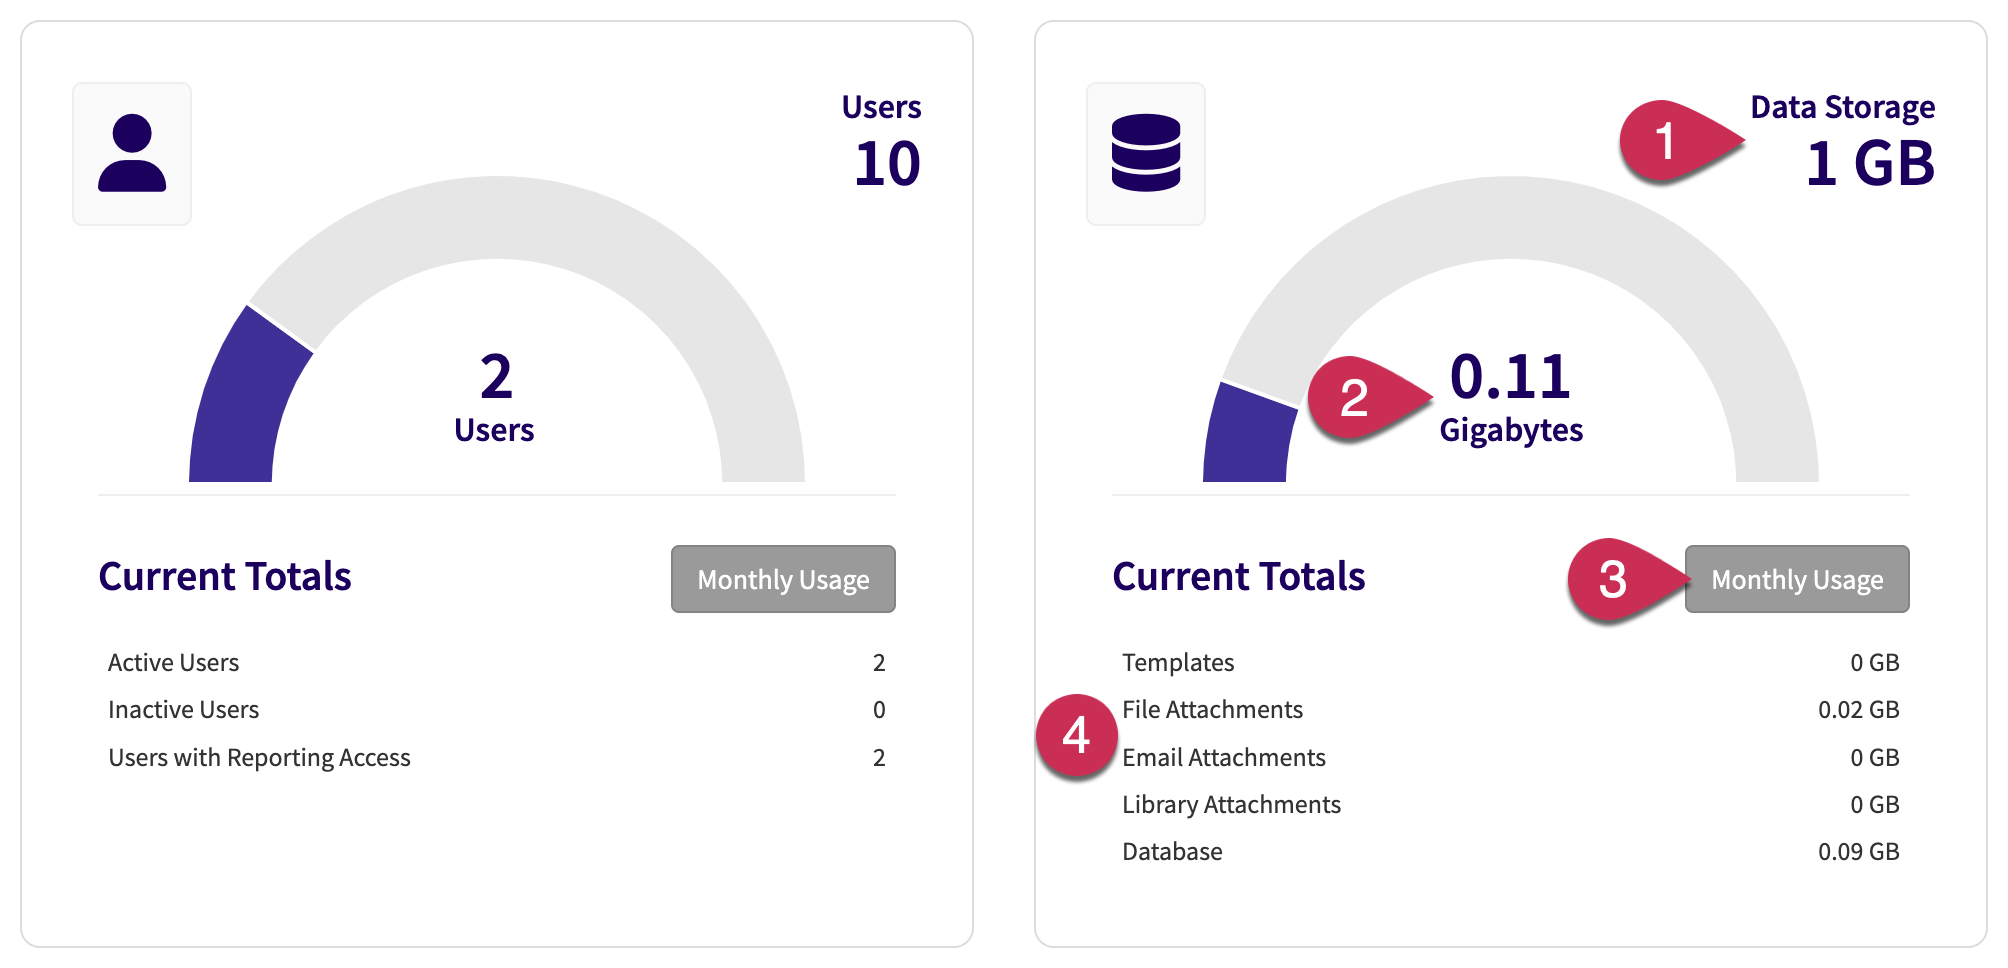
- Data Storage Allowance: indicates the total amount of data that can be stored per your contract. If the highest amount of data stored in a month exceeds the data storage allowance, the estimated overage charges for the additional stored data will be displayed under the data storage allowance.
- Highest Amount of Data Stored: the odometer shows the highest amount of consumed data during the current month, which is calculated daily at midnight. This number will not decrease during the current month, even if you delete files in the application.
- Monthly Usage button: click to see a chart of the running total of stored data by month (see an example below).
- Current Totals: the current amount of data stored in the application by file type. The current totals are updated in real time and will immediately reflect newly attached or deleted files in the application. This means that the current totals and numbers in the odometer graphic (#2 in the Data Storage Odometer screenshot above) may display different values before the odometer is updated at midnight.
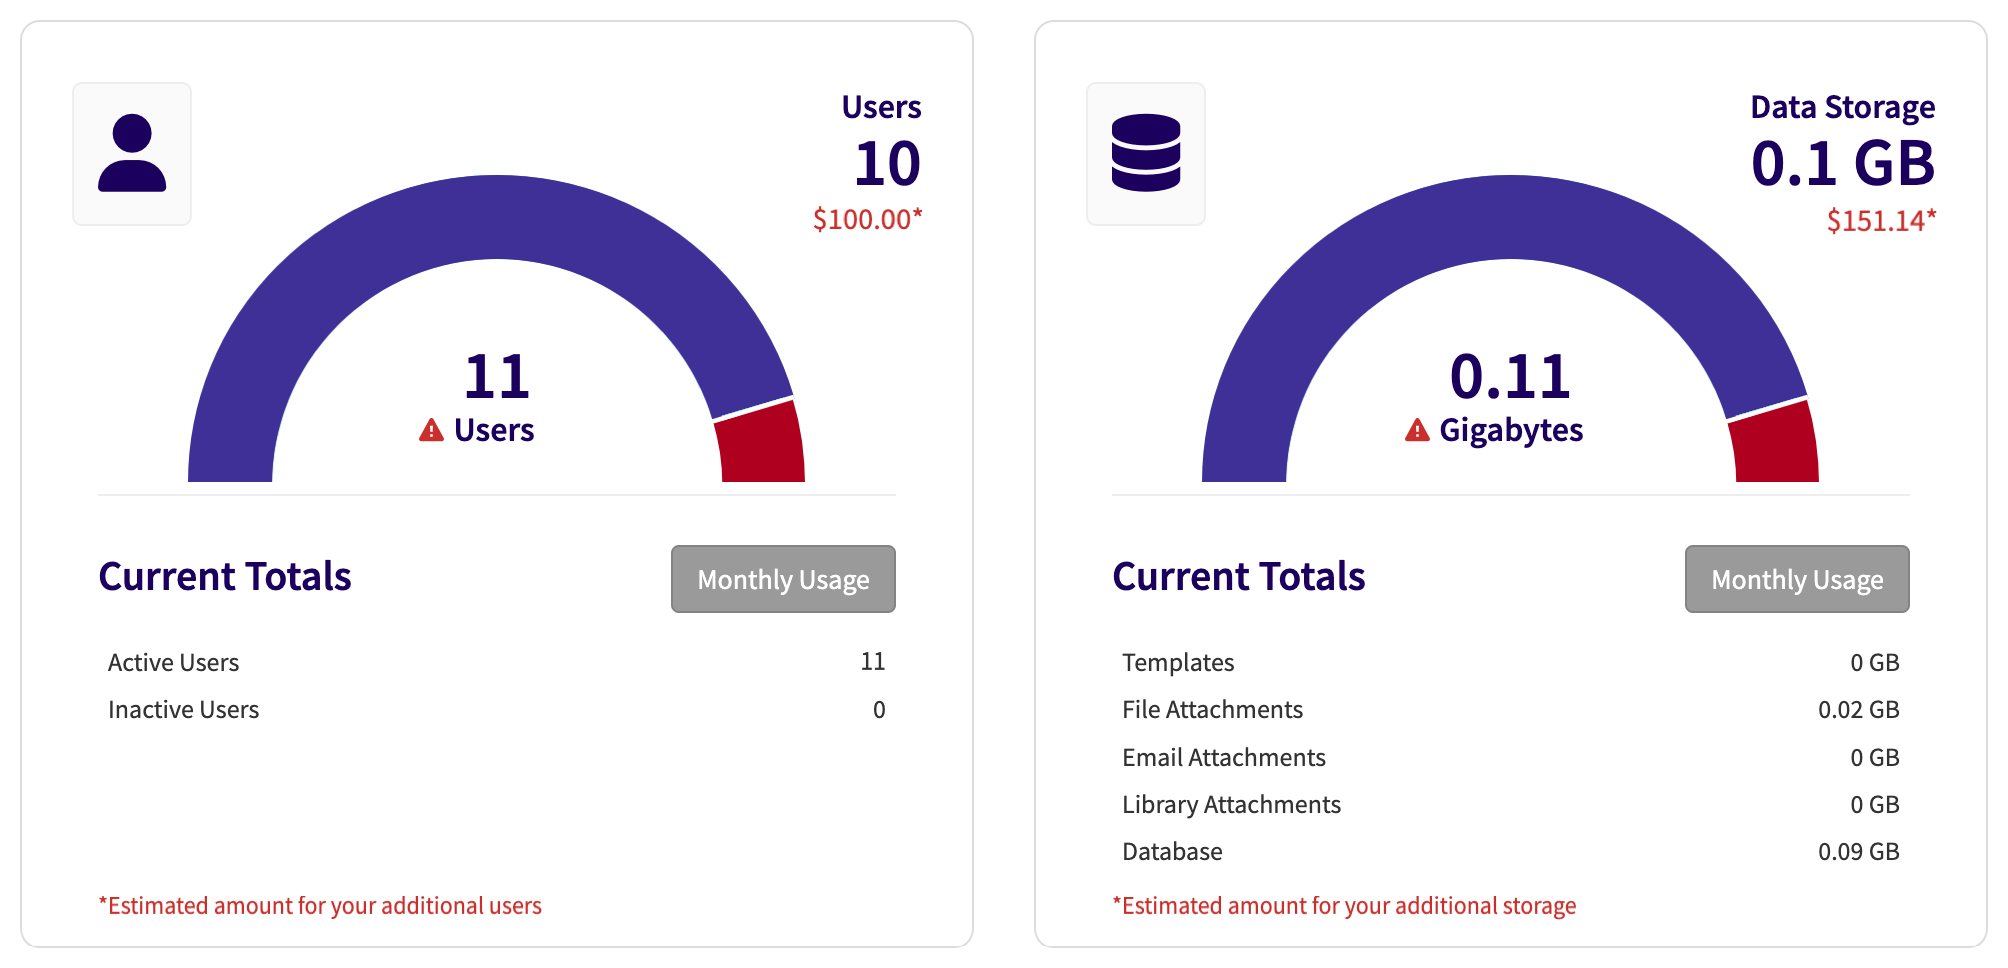
If your organization exceeds either your user allowance or data storage allowance:
- The system will send System Administrators a notification to alert them of the overage (read more in System Notifications).
- The Users Odometer will show the number of users by which you have exceeded your user allowance.
- The Data Storage Odometer will show the amount of data by which you have exceeded your data storage allowance.
- The estimated overage charges for the number of additional users and the amount of additional stored data will be displayed under the respective allowance value. The application in the example screenshot below shows both user and data overages:
