View a Case's Details
View a case’s details by clicking a case row in the Cases grid. The following section will review all case details on a case's page, as illustrated in the screenshot below.

- Case number: a unique, system-generated number to identify the case.
- Bookmark toggle: bookmark cases by clicking the star icon. An orange star denotes a bookmarked case. On the Cases Grid, you can narrow down your results to view only your bookmarked cases using the “List” filter.
- Workflow timelines: shows the current status of the case in workflows (see Workflows).
- Edit Case button: click to update case details and fields (see Edit a Case).
- Add button: click to add a record to the case.
- Options button: access additional case actions. Read the following articles for more details:
- Case details (also known as case tombstone): basic information about the case (up to eight fields) and the case assignment. See Assign a Case for details on assigning cases.
- Tabs: navigation options to find more specific information about the case. See more details in the next section of this article, Case's Page Tabs.
- Sub-tabs: each tab can have its own sub-tabs with additional options and information on the case. See more details in the next section of this article, Case's Page Tabs.
Case's Page Tabs
Each case's page contains separate tabs under the Case Details section to bring all associated information together about the case in one page.
- Details: provides more information on the case, containing the “Overview” sub-tab. There may be additional sub-tabs depending on your application's configuration.
- Overview sub-tab: contains all fields entered on the New Case page and any post-intake data, which are custom for your application.
- Activity: displays all associated records of the case, including notes, to-dos, emails, and any custom forms.
- Calendar: view all associated case events, such as to-dos and appointments (see Calendar).
- Parties: lists all parties associated with the case (see Parties).
- Files: a resource of all files that have been added to the case (see Files).
- Links: see links between other cases and profiles as well as links between the case's records (see Link Related Cases, Link a Case's Records, and Link a Profile to a Case).
- History: an audit trail of everything that has happened to the case (see History).
View Record Source
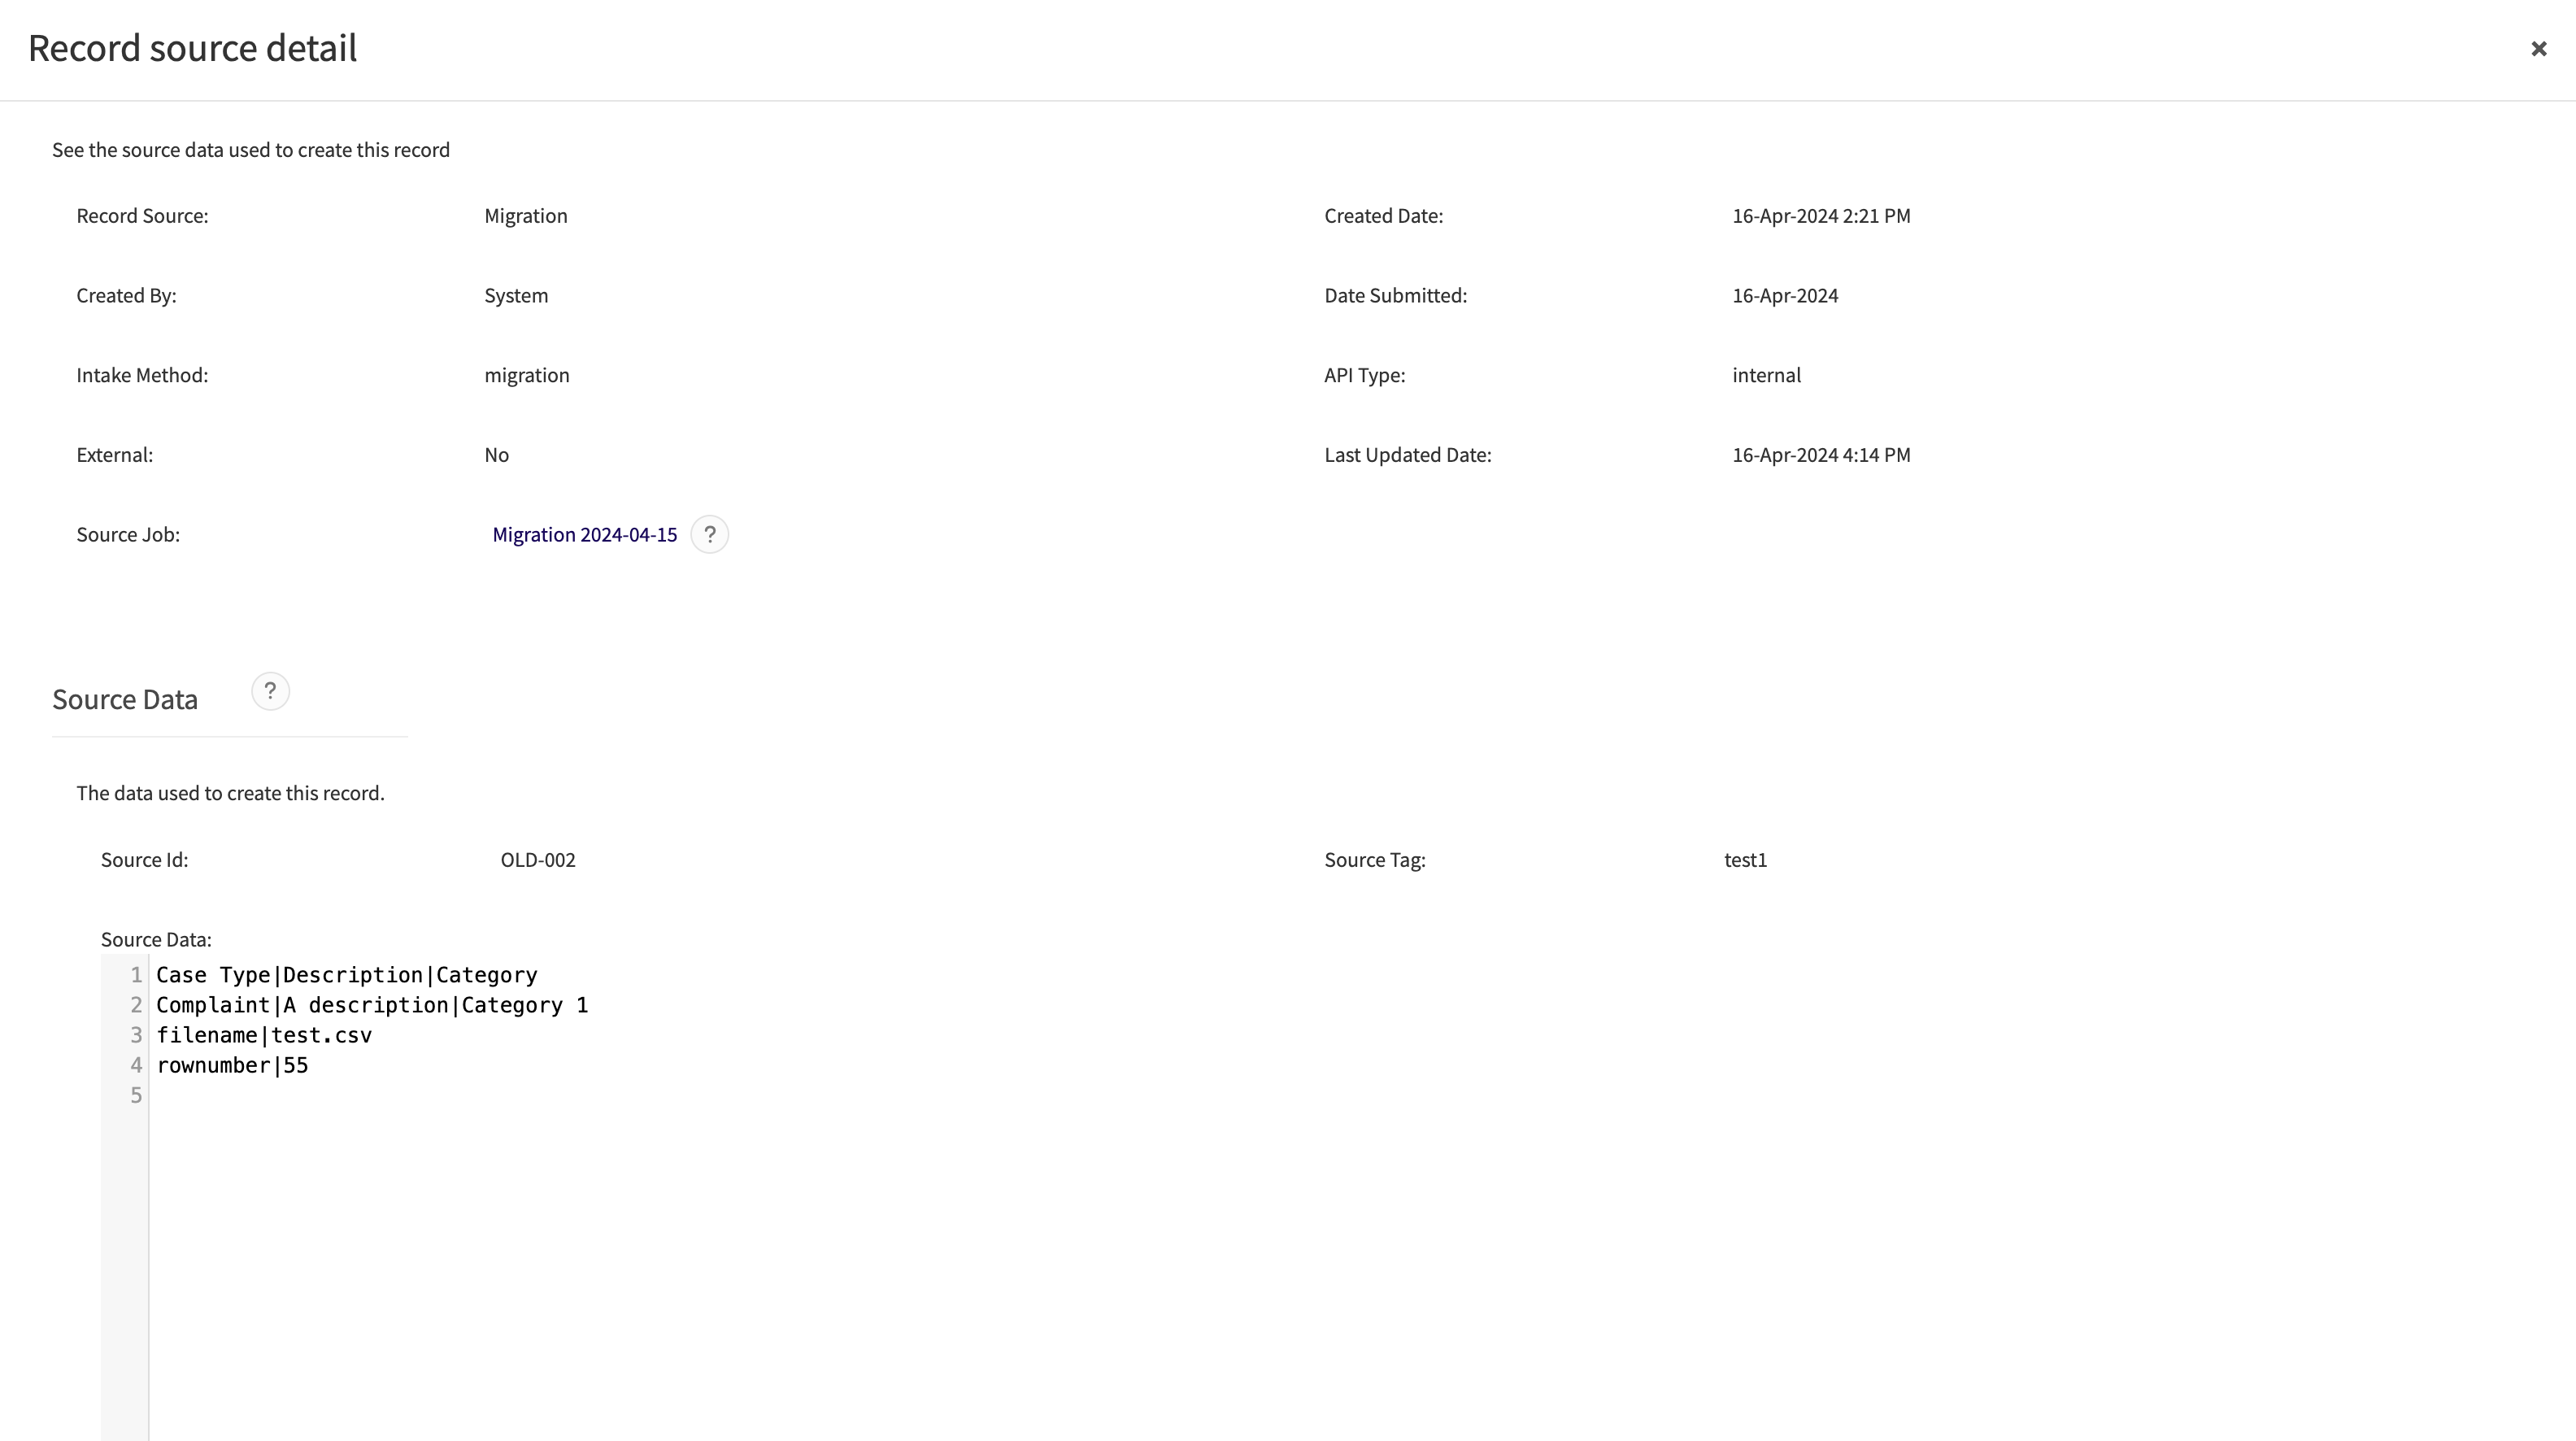
You can use the "View Record Source" option to monitor or troubleshoot your application’s data migrations or integrations. "View Record Source" will pull up the "Record source detail" pop-up, so you can check the system fields' values when the case was created. If the case was created by an integration or data import, you will also see the "Source Job" field and "Source Data" section in this pop-up. The "Source Data" section will show the row in the data import file that the system used to create the case. You can check out the integration log that the system recorded when it processed that data import file by clicking the link in the "Source Job" field.